Apr 30, 2013

ទីផ្សារមាសបានស្ងប់ស្ងាត់


ទីផ្សារមាសបានស្ងប់ស្ងាត់សម័យទំនាក់ទំនងនោះបន្ទាប់ពី gapping ខ្ពស់ជាងនេះនៅបើកចំហនៅថ្ងៃច័ន្ទ។ ទីផ្សារដែលទទួលបានប្រហែល 1% និងត្រូវបានឥឡូវអង្គុយខាងលើ $ កម្រិត 1450 ម្តងទៀត។ ជាមួយនឹងការបញ្ជាក់ថាករណីនេះយើងគិតថាកម្រិត $ 1550 នឹងនៅទីបំផុតត្រូវបានគោលដៅទោះបីជា $ 1500 ពិតណាស់នឹងមានផលប៉ះពាល់ផ្លូវចិត្តនៅលើអ្នកទិញនោះទេ។ យើងមិនរំពឹងថានឹងមានការផ្លាស់ទីកាន់តែខ្ពស់ទៅជាមានភាពងាយស្រួលនិងយ៉ាង pullback យាយដោយស្មោះត្រង់ជាមួយនឹងមិនភ្ញាក់ផ្អើលទេចំពោះយើង។ ប៉ុន្តែសម្រាប់អ្នកទាំងឡាយណាដែលមានបន្ថែមទៀតអ្នកវិនិយោគរយៈពេលវែងទីផ្សារនៅទីនេះគួរតែបន្តផ្តល់ជូននូវប្រាក់ចំណេញនៅក្នុងរយៈពេល
យូរអង្វែង។

អ្នកគួរតែទិញមាសឬបើមិនមាន?


អ្នកគួរតែទិញមាសឬបើមិនមាន? នោះហើយជាសំណួរនិងមនុស្សគ្រប់គ្នាហាក់ដូចជាមានចម្លើយមួយ។ ជាអកុសលពួកគេមិនដែលដូចគ្នានេះ។ ក្រុមអ្នកវិភាគមួយចំនួនភ័យខ្លាចក្នុងតម្លៃទាបនៃមាសដែលយើងបានឃើញនៅក្នុងខែកន្លងទៅនេះច្បាស់ណាស់ថានឹងមានសញ្ញាធ្លាក់ចុះមួយផ្សេងទៀត។ អ្នកផ្សេងទៀតនិយាយថាវាគ្រាន់តែជា fluke និងបង្ហាញអំពីភាពត្រឹមត្រូវដោយវាជាការពិតដែលថាតម្លៃមាសត្រូវបានធ្វើអោយប្រសើរឡើងនូវការ។ យឺតបាទប៉ុន្តែនៅតែធ្វើអោយប្រសើរឡើងនូវ។
តម្លៃមាសឡើងថ្លៃកំពុងឡើង $ 22,00 ទៅ $ 1,475.60 មួយអោន។ វាគឺជាការពិចារណាផងដែរខាងក្រោម $ 1,400 អោនពេលពីរសប្តាហ៍កន្លងទៅនេះអ្នកវិនិយោគជាច្រើនត្រូវបានដកដង្ហើមសញ្ញានៃការធូរស្រាលដូចដែលវាបានកើនឡើងឥតឈប់ឈរ។ ប្រសិនបើនិន្នាការនេះនៅតែបន្តមាសនឹងមានជាង $ 1,500 អោនមួយនៅក្នុងពេលវេលាទេ។
តើអ្វីទៅជាវិនិយោគិនចាំបាច់ត្រូវយល់ពីនោះគឺថាដូចជាជាមួយនឹងអ្វីមាសនឹងមានថ្ងៃល្អនិងថ្ងៃអាក្រក់របស់ពួកគេ។ បញ្ឈប់ការខាតបង់-នឹងកើតឡើងនិងប្រាក់ចំណេញនឹងត្រូវបានធ្វើ។ ប៉ុន្តែវិធីនោះទេគឺវាជា "រឿងរ៉ាវប្រាកដថា" ថាប្រសិនបើអ្នកនៅក្នុងការវិនិយោគលើមាសអ្នកនឹងចេញមកផ្តួលជាងអ្វីដែលអ្នកធ្លាប់គិតថាការស្រមើលស្រមៃ។ ប្រសិនបើអ្នកចូលមកក្នុងអាជីវកម្មមាសរំពឹងថានឹងវាឱ្យទៅជាមានភាពងាយស្រួលជាងអ្នកបានត្រូវបានគេច្រឡំឈឺចាប់ខ្លាំងណាស់។ ប្រសិនបើតម្លៃមាសឡើងថ្លៃជាចំណុចបង្កើនការអ្វី? មនុស្សគ្រប់រូបនឹងត្រូវបានម្ចាស់លុយនៅក្នុងមាស។ ជាសំណាងល្អឬជាអកុសលជាវិនិយោគិនមួយអ្នកត្រូវតែយកល្អជាមួយអាក្រក់។ វិនិយោគិននាពេលបច្ចុប្បន្ននេះកំពុងរៀនថាវិធីរឹង។ ប៉ុន្តែលោកសង្ឃឹមថាពួកគេនឹងភ្លេចទុក្ខព្រួយនាពេលបច្ចុប្បន្នរបស់ពួកគេនៅពេលដែលមាសនៅទីបំផុតទទួលបានត្រឡប់មកវិញបានរហូតដល់ការធ្វើពាណិជ្ជកម្មនៅ $ 1,800 អោនមួយនៅក្នុងពេលអនាគត។

Apr 26, 2013

26/04/2013


The XAU/USD pair had a bullish day as gold buying frenzy continued to drive prices higher. Also the recent weakness in the American dollar has been providing support for the shiny metal. Yesterday, the pair traded as high as 1469.18 after the bulls shattered the first barrier. In my previous analysis I had told that the bulls will eventually reach 1555 but frankly I was thinking that this area might be a cap on gold prices. Since we broke above the Ichimoku cloud (and we also have a bullish Tenkan Sen – Kijun Sen cross) on the 4-hour time frame, I believe the bulls will be controlling the XAU/USD pair in the-near term. Currently the pair is trading at 1476.53, just above the previous resistance level of 1473. If the bulls successfully hold above this level, we will probably see 1486 printing on our screen before a pull back occurs. Beyond 1486, the real challenge will be waiting the bulls at the 1495 - 1500 area.
លើសពី 1486 ដែលជាបញ្ហាប្រឈមពិតប្រាកដនឹងនៅរង់ចាំ ឡើង នៅ 1495 - 1500 តំបន់។


This is a vital level that the bulls have to pass in order to push prices higher. However, if the bears increase the pressure at 1486 and prices reverse, look for support at 1473, 1455 and 1444. Today investors' focus will be on the U.S. growth data, so expect some volatility.
XAUUSD Weekly

Apr 24, 2013

Trading Central: Technical analysis for Gold on London 24/04/2013

Gold: upward trend.

Pivot: 1404.
Gold Strategy: Buy on the 1404.
+ Take Profit: 1439 & 1473.
+ Stop loss: 1391.

Apr 23, 2013


The XAU/USD pair advanced towards the critical resistance level at 1444 yesterday as a weaker U.S. dollar lured some investors back to the market. The latest massive gold sell-off was initially ignited by the prospect of slowing Chinese economy, concerns over the Eurozone's debt crisis and speculations that the U.S. Federal Reserve will end its bond buying program sooner than anticipated. A sustained rally in U.S. and Japan stock markets has been another important element. Although there is a growing conviction that the dollar is likely to strengthen, physical demand seems to be strong at this points. However, how long this buying frenzy will continue is a mystery. I think the sudden and steep fall in gold prices indicates a strong technical and fundamental shift in the market.
Because of that, I have no intention of buying gold (for a long-term) until my technical analysis signals that the bears lost their control over the prices. From a short-term perspective, I will be paying attention to the levels I marked on the 4-hour chart. It seems that the XAU/USD pair will continue to wonder around the 1426 before it picks a direction.
Right now prices entered the Ichimoku clouds and that means the pair will be range bound for some time. Technically speaking, the thicker the Ichimoku cloud, the less likely it is that prices will manage a sustained break through it. In our case, the XAU/USD pair will need to break either above 1555 or below 1398 before it can resume trending. The first resistance ahead of us is located at 1444 and beyond 1555 there is a significant resistance around the 1469/1473 zone. To the downside, there is an interim support at 1411. If gold prices break below that level, the market will probably test the 1398 level which happens to be the upper band of previous consolidation area. A daily close below 1398 would suggest that we might revisit 1386 and 1363.


23/04/2013

Short Term trend: Bearish 
Intraday Bias: Conditionally bearish
Gold is struggling to break above 1428.00 resistance level, the price has formed a bearish shooting star candle while failing to record a closing above the level on a four-hour closing basis. Accordingly, we may see attempts to resume the overall bearish wave today, but for further confirmation we need to see a break below 1417.00 level to expect a move towards 1400.00 again.


** Short term ( Less than three months)
** Chart is based on GMT+2 timing 

Notes: 
*if price reaches within 20% from target before triggering entry, signal is canceled and not valid anymore.
Support1403.001590.001362.001340.001320.00
Resistance1428.001440.001460.001478.001495.00
RecommendationBased on the charts and explanations above, we prefer to short gold below 1417.00 targeting 1403.00 and 1390.00. Stop loss above 1428.00

Apr 22, 2013

Gold forecast

Short Term trend: Bearish 
Intraday Bias: Bullish 
After retesting 1400.00 support level on Friday, gold rebounded with the start of the week attempting towards 1428.00 resistance level once again, a break above this resistance may extend the correctional even further, probably towards 1460.00 areas. On the other hand, the bearish continuation scenario may evolve if price breaks back below 1391.00, accordingly, as long as trading remains above the aforementioned level, we will anticipate further upside this week.


** Short term ( Less than three months)
** Chart is based on GMT+2 timing

Notes:
*if price reaches within 20% from target before triggering entry, signal is canceled and not valid anymore.
Support1400.001390.001362.001340.001320.00
Resistance1425.001440.001460.001478.001495.00
RecommendationBased on the charts and explanations above, we prefer to long gold above 1400.00 targeting 1410.00,1428.00 and 1450.00. Stop loss below 1390.00

Apr 19, 2013

gold 19/04/2013

After a choppy session the XAU/USD pair (Gold vs. the Greenback) closed the day higher as lower prices continued to lure Asian buyers. In addition to increasing demand for physical gold, short covering ahead of the G20 meeting helped the bulls to defend the 1333 support zone. Yesterday's candle indicates that the bears are running out gas, at least for now. Although I don't expect another huge drop in the near term, I think we will eventually reach 1266 sooner or later. Of course, how the U.S. Federal Reserve plays its cards will have a strong impact in the gold market. In the meantime, I will be paying attention to the major equity markets. A massive correction especially in US and Japan equities will likely to be supportive for gold prices in the short term.
Today the key levels to watch will be 1398 and 1363. If a bullish break out occurs, I will be looking for 1411 and 1426. There is a strong resistance area which runs from 1426 up to the 1455 level. If we get up there, I will be looking for signs of exhaustion in order to go short. However, if the bulls fail to break through the 1398, this area might turn into a strong resistance and push gold prices back to the 1363 support level. A break below 1363 would suggest that we will be heading towards the 1333 level once again.

gold forecast


ដោយផ្អែកលើតារាងនិងការពន្យល់ខាងលើយើងពេញចិត្តដើម្បីធ្វើមាសរយៈពេលយូរខាងលើ 1400,00 ដែលផ្ដោតសំខាន់ទៅ 1428,00 និង 1450,00 ។ បញ្ឈប់ការបាត់បង់ខាងក្រោម 1380,00
Gold: down trend. 
Pivot: 1403.

Gold Strategy: sell below 1403.

+ Take Profit: 1322 & 1295

+ Stop loss: 1444.
The pair is trading along an sideways trading pattern.
An uptrendl start from support level 1328, which will be followed by moving up to resistance level 1418.

An downtrend will start as soon, as the pair drops below support level 1328, which will be followed by moving down to support level 1260.

Supports: 1328, 1260
Resistances: 1385, 1418

Apr 16, 2013

Gold Price Analysis - April 16, 2013


Faster than a speeding bullet, more powerful than a locomotive...Yes, I am talking about gold! The XAU/USD pair continued its freefall yesterday and as a result we have returned to a level which hasn't been seen since the beginning of 2011. The pair traded as low as 1335 on weak Chinese data, hedge-fund liquidation and technical selling pressure. Disappointing gross domestic product and industrial production data out of China boosted worries about economic growth. In the meantime, CME Group Inc. said it will increase the margin requirements on gold trading by 19% at the close of today’s session. In my previous analysis, I had told that I was expecting prices to hit 1325/20 and 1266 but I have to admit that I didn't imagine a huge collapse like this. The recent price action shows there is no one buying and picking a bottom yet. We are trading below the Ichimoku clouds and the Tenkan-sen line (nine-period moving average, red line) dropped below the Kijun-sen line (twenty six-day moving average, green line) on almost all time frames. Since this move is not just a simple correction, buying gold at this point would simply be a very risky gambling.

However, I will be watching the support zone between 1333 and 1320 levels today. This zone might be a place where the sellers would like to take some profit off the table. If that is the case, plenty of resistance can be found at 1371, 1381 and 1393. If we rally I will be looking for weakness to sell. A close below 1320 would make me think that we will be testing the 1308, 1296 and 1266 support levels next.

gold forescast


Gold witnessed the biggest one-day selloff in its history yesterday, plunging to record a low at 1320.00 level, before rebounding with the start of today’s session. The drop suggests that the sell-off could be exaggerated, and usually when we witness such sell-offs, it leads to major volatility where correctional bounces can be strong and lengthy. Accordingly, we will look to short the metal but at a higher price.


** Overall trend ( More than one year)
** Intermediate ( More than three months)
** Short term ( Less than three months)
** Chart is based on GMT+2 timing
Notes: 
*if price reaches within 20% from target before triggering entry, signal is canceled and not valid anymore.
Support1320.001308.001300.001285.001260.00
Resistance1385.001400.001425.001440.001458.00
RecommendationBased on the charts and explanations above, we prefer to short gold around 1385.00, targeting 1350.00 and 1325.00 Stop loss above 1400.00

Apr 15, 2013

gold forecast


Gold plunged, the yellow metal has lost its glitter falling aggressively to break the long-term support at 1525.00 level, and that resulted in a panic, sending the metal to levels near 1425.00, where price is currently testing the 200-weeks SMA. The technical structure has turned extremely bearish, as the long term bullish trend is starting to be damaged, and accordingly, rallies should be treated as new opportunities to short.


** Overall trend ( More than one year)
** Intermediate ( More than three months)
** Short term ( Less than three months)
** Chart is based on GMT+2 timing
Notes: 
*if price reaches within 20% from target before triggering entry, signal is canceled and not valid anymore.
Support1442.001432.001425.001410.001400.00
Resistance1462.001472.001480.001495.001500.000
RecommendationBased on the charts and explanations above, we prefer to short the metal below 1480.00 targeting 1430.00,1400.00. and 1380.00. Stop loss above 1510.00

Gold Weekly Technical Outlook


Gold decline accelerated sharply last week through 1500 psychological to close at 1476.1, even below 1478.3 medium term support. Outlook is not looking good. Initial bias will stay on the downside this week and deeper fall could now be seen to next key support level at 1400, which is close to long term projection level at 1398.3. On the upside, break of 1539.4 resistance is needed to signal short term bottoming or outlook will stay bearish in gold.
In the bigger picture, last week's acceleration in this stage of fall is raising the chance that fall from 1923.7 is a long term down trend and is far from being over. Close attention will now be paid to 38.2% retracement of 681 to 1923.7 at 1449.0. Decisive break there should at least bring medium term fall to 61.8% retracement at 1155.7 and below. On the upside, break of 1616.5 is now needed to indicate medium term reversal or outlook will stay bearish.
In the long term picture, the break of 1478.3 support now raised the chance of long term reversal. Q2 and Q3 will now be critical gold. Further downside acceleration will send gold through 55 months EMA (now at 1383.6) decisively. And in that case, we'd likely see long term decline back to 681/1033.9 support zone. Meanwhile, strong rebound from the 55 months EMA will turn gold into sideway pattern instead.
Comex Gold Continuous Contract 4 Hours Chart
Comex Gold Continuous Contract Daily Chart
Comex Gold Continuous Contract Weekly Chart
Comex Gold Continuous Contract Monthly Chart

16/04/2013


The XAU/USD pair had an interesting week, as prices finally broke below the 1532 support level which was the bottom of a giant consolidation zone. Gold prices had been running in this rectangle more than 80 weeks. As a result, breaking below the support zone that has been holding this market up since September 2011 triggered a sell-off during the Friday session. The pair traded as low as 1480.04, a level not seen since July 1, 2011. Although this is an extremely bearish situation which indicates a major correction might be on its way, it is possible to see a bounce before heading low. Technically speaking, when a strong support (or resistance) line is broken, the market may respond and retest it before continuing the trend. Such pullbacks could provide nice selling opportunities in this market.


If the bears continue to dominate gold prices, based upon the measurements, my short-term target will be the 1446.50 level. On its way down, expect to see some support at 1478 and 1473. In the long run, I think the ultimate goal for the bears will most likely be 1325 and 1266. As for buying, I can't see any technical or fundamental reason to do so. Prices are below the Ichimoku clouds and we have bearish Tenkan-sen (nine-period moving average, red line) - Kijun-sen line (twenty six-day moving average, green line) crosses on all time frames. It seems that gold prices will remain under pressure amid expectations the Federal Reserve will end its asset buying program some time this year. If the pair finds support at these levels and turns north, there will be resistance at 1500, 1513 and 1532.50.


Apr 12, 2013

12/04/2013


The XAU/USD pair (Gold vs. the American dollar) closed the day slightly higher than opening as the lowest prices since last summer attracted some buyers yesterday. However, better-than-expected data out of the U.S. limited the shiny metal's gains. Data released by the Department of Labor showed that the number of Americans who filed for unemployment insurance payments for the first time decreased by 42000 to 346000, pointing to further improvement in the labor market. Recently the pair has been trying to build some type of base just above the 1554 level but charts don't show any real bullish momentum. Major equity markets continue to rally and USD/JPY is approaching to its highest level since May 2009. From a technical point of view, I think a weekly close under the 1554 level will be highly negative for the pair since we are currently trading below the lowest settlement price since mid-2011.

If the bulls fail to defend this critical support and we end the week below that level, speculative selling pressure would increase drastically. If that is the case, I will be looking for 1546.50, 1540.10 and 1532. To the upside, the first challenge will be waiting the bulls at 1568. If prices break above this level, we could possibly see the bulls make a run for the 1574 level which happens to be the top of the Ichimoku clouds on the 4-hour time frame. A close above the 1574 resistance would signal that the pair is most likely headed for the next strong resistance levels at 1583 and 1590.


Apr 11, 2013

gold 10/04/2013

Gold is flirting with 1580.00 level, where the short term ascending trend line for the recent bounce is located. A break and stability below this area could signal another downside attempt, and probably a retest of 1567.00 key low. A few hours of trading below 1580.00 could lead to further intraday losses.


** Overall trend ( More than one year)
** Intermediate ( More than three months)
** Short term ( Less than three months)
** Chart is based on GMT+2 timing
Notes: 
*if price reaches within 20% from target before triggering entry, signal is canceled and not valid anymore.
Support1576.001567.001563.001555.001550.00
Resistance1580.01590.001600.001610.001615.00
RecommendationBased on the charts and explanations above, we prefer to short gold with a four-hour closing below 1580.00, targeting 1567.00. Stop loss above 1585.00

Apr 9, 2013

Gold Price in April 2013


It seems that collective memory is becoming shorter and shorter. We just celebrated two important holidays in the Judeo-Christian traditions that commemorate events that took place thousands of years ago. Yet, now, in the age of Internet, people seem to forget major events after weeks, or even days. Given this weeks’ performance in the precious metals, people have forgotten that only two weeks ago Cyprus was on the brink of unraveling not only the European union, but the sacrosanct foundations of fractional banking, with the crisis highlighting the fundamental fault lines of both.
On Wednesday silver for immediate delivery slid as much as 1.3 percent to $26.9175 an ounce, the lowest since July 25. Gold is now trading below the pre-Cyprus crisis level and is challenging the two-month low.
There is a difference between a bear market and a correction, which is a short-term trend with a shelf life of less than two months. In a bear market, widespread pessimism becomes self-sustaining. Many consider a downturn of 20% or more over at least a two-month period to be an entry into a bear territory. We disagree with this definition in case of precious metals. The secular bull market remains in place as long as fundamentals remain in place – and that is clearly the case with silver.
According a Credit Suisse Group AG report Wednesday, global government stimulus has cut the likelihood of further banking and liquidity crises and reduced the need for a protection of wealth. The bank cut its 2013 gold forecast by 9.2 percent to $1,580 and lowered its silver estimate by 11 percent to $28.50.
We can only guess that the folks at Credit Suisse have forgotten as well. It was only last Thursday that Cyprus cautiously opened the doors of its banks but tightly rationed withdrawals. People could only withdraw 300 euros of their own money, couldn’t freely cash checks or use their bank to pay suppliers who use other banks. In a few short weeks Cyprus lost its status as an off shore banking center with a banking sector 7 times larger than the annual GDP.
The restrictions are meant to keep Cypriots from emptying their accounts in the wake of the bailout deal announced last Monday that would drastically prune Cyprus’s oversized banking sector, bloated by deposits from Russia and other former Soviet Union countries. Although the deal scrapped the highly controversial idea of a tax on bank deposits, it would still require forced losses for depositors and bondholders, with the amount to be yet determined. The ink has not even dried on the Cyprus story. We have gotten the message loud and clear that gold and silver are the ultimate monetary assets. Now we need to wait for everyone else to get it without losing our shirts in the process.
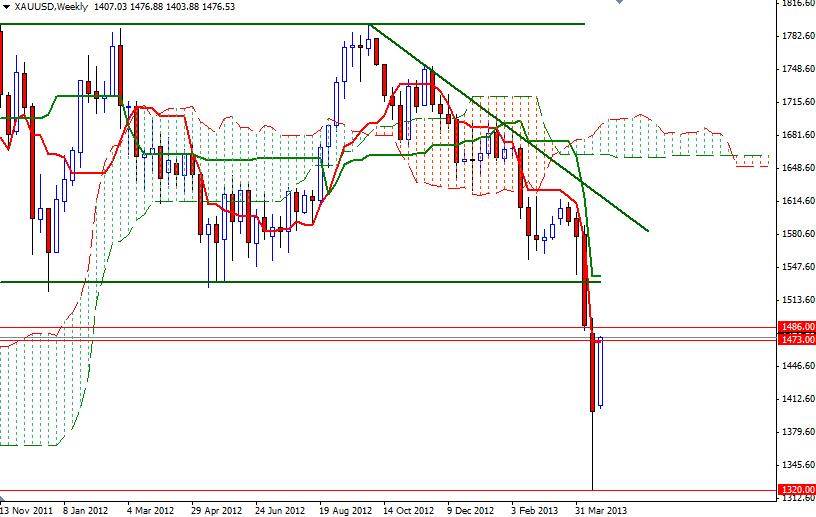
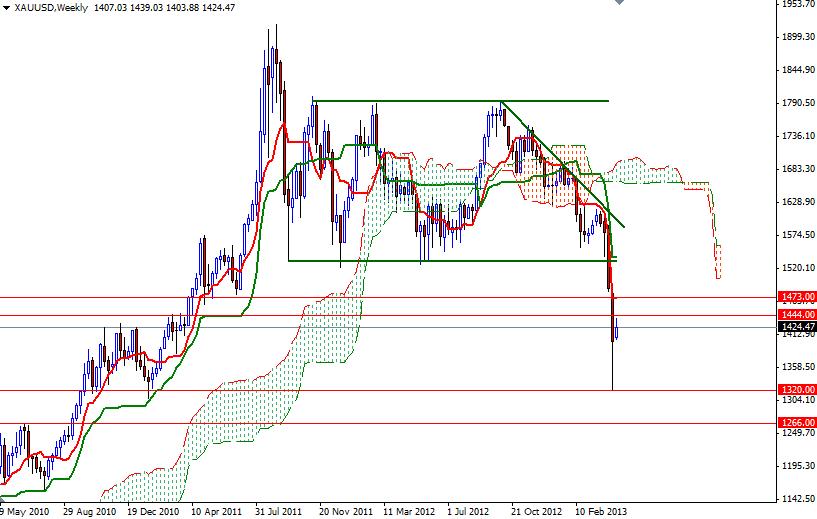
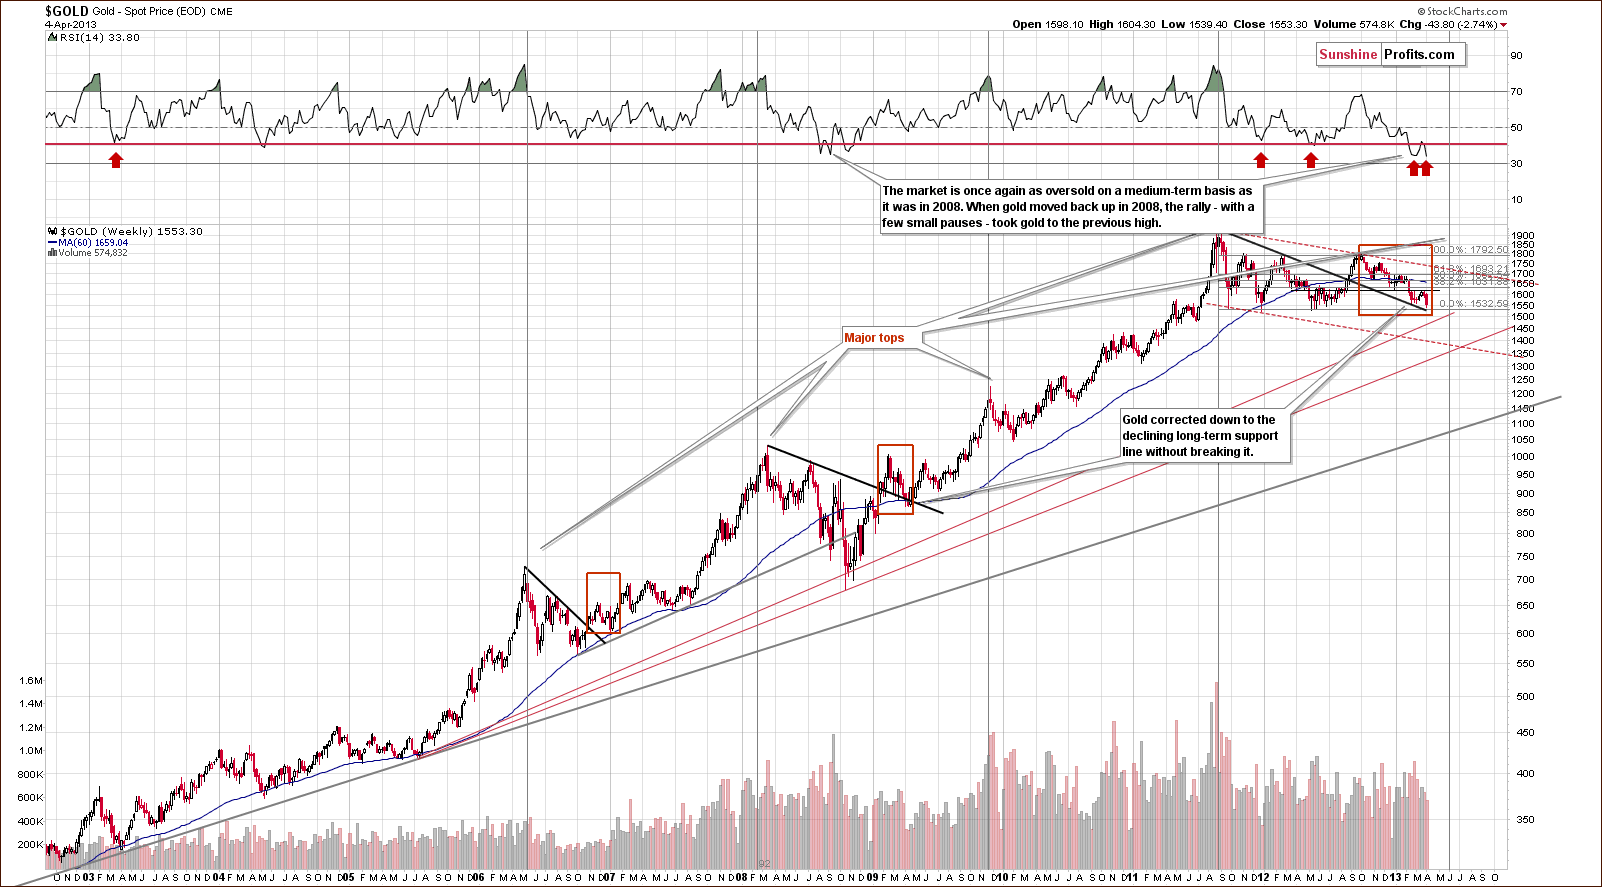
We have gotten the message loud and clear so let’s have a look at the yellow metal’s technical picture – we’ll start with its the very long-term chart (charts courtesy by http://stockcharts.com.)
Very long-term Gold price chart
We saw a significant price decline this week.
Even though the situation is still bullish, as gold is above its long-term support lines, it seems that it could be the case that the next long-term turning point in gold may be a major bottom as opposed to a top.
At the same time, although prepared and looking to the downside target level, it does not mean that the situation is bearish for the medium term. RSI levels are still oversold, so gold may not decline significantly.
As we discussed in Thursday’s Market Alert sent to our subscribers:
Gold could actually decline to $1,350 or $1,100 and still remain in a secular bull market (in mid-70's this gold retraced almost 50% of its earlier high). Don't panic - this is not a likely outcome. The consolidation is already almost 2-years long (2-years long in case of silver), investors are already very discouraged and the fundamental situation (QEs among other things) is in our opinion more favorable than it was in the 70s.
Let us now see how the situation looks like from the non-USD perspective – we’ll use a GOLD:UDN ratio as a proxy here.
Gold from the non-USD perspective - GOLD:UDN
Here we see mixed short-term signals this week. The breakout above the declining resistance line has been invalidated, but the declining support line has held. Even if broken, another is just a bit lower. The situation is mixed for the short term but the medium-term outlook remains positive.
Let’s have a look at the yellow metal priced in Japanese Yen now, as some important bullish events took place on this market.
Gold from the Japanese yen perspective - GOLD:XJY
We see there was a sharp decline on Wednesday followed by a quick pullback on Thursday when the Bank of Japan announced a huge round of quantitative easing. This is indeed a very significant move and a very positive long-term factor for gold. Gold reacted immediately and in terms of the yen remains quite bullish.
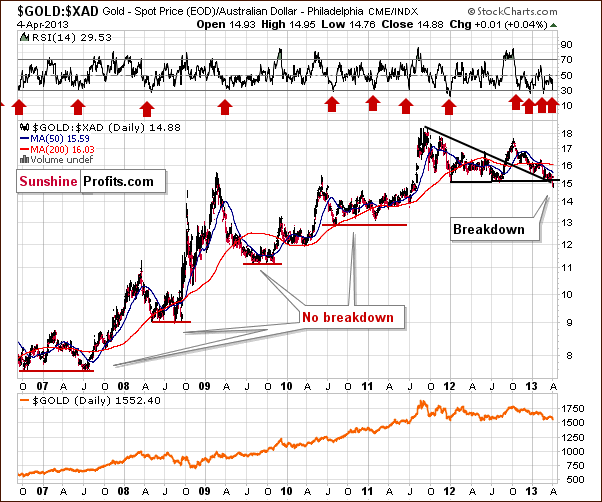
Finally, let us turn to gold priced in Australian dollar.
Gold from the Australian dollar perspective - GOLD:XAD
This is our most concerning chart today. Periods of consolidation over the past six years have not resulted in gold’s price moving below the previous low until now.
Summing up, if we see a repeat of this week’s price declines, we will likely need to consider hedging long-term positions in gold. So far, no breakdown has been seen except for gold priced in Australian dollars and at the same time we have a breakout in case of gold priced in the Japanese yen. The medium and long-term outlooks remain bullish.
What to monitor in order to determine if gold, silver and mining stocks are going to plunge? The mining stocks have already broken below their key support levels - how low can they go? How low will likely gold and silver move if they break below their previous lows? Answers to these questions should greatly help you position yourself in this market and determine if you should really be concerned with the current daily price swings (hint: you most likely should). We encourage you to join our subscribers, read today's Premium Update that deals with the above questions and stay informed via daily Market Alerts.
Gold moved slightly lower during the European session, while we continue to expect that dips maybe limited to 1565.00-1563.00 area, a break below 1563.00 will be concerning, however the suggested bullish scenario should remain intact so long as 1550.00 is holding.

** Overall trend ( More than one year)
** Intermediate ( More than three months)
** Short term ( Less than three months)
** Chart is based on GMT+2 timing
Notes: 
*if price reaches within 20% from target before triggering entry, signal is canceled and not valid anymore.
Support1567.001563.001555.001549.001540.00
Resistance1576.001580.001590.001600.001605.00
RecommendationBased on the charts and explanations above, we prefer to long the metal above 1562.00 targeting 1580.00,1590.00 and 1600.00. Stop loss below 1549.00