Apr 16, 2013

Gold Price Analysis - April 16, 2013


Faster than a speeding bullet, more powerful than a locomotive...Yes, I am talking about gold! The XAU/USD pair continued its freefall yesterday and as a result we have returned to a level which hasn't been seen since the beginning of 2011. The pair traded as low as 1335 on weak Chinese data, hedge-fund liquidation and technical selling pressure. Disappointing gross domestic product and industrial production data out of China boosted worries about economic growth. In the meantime, CME Group Inc. said it will increase the margin requirements on gold trading by 19% at the close of today’s session. In my previous analysis, I had told that I was expecting prices to hit 1325/20 and 1266 but I have to admit that I didn't imagine a huge collapse like this. The recent price action shows there is no one buying and picking a bottom yet. We are trading below the Ichimoku clouds and the Tenkan-sen line (nine-period moving average, red line) dropped below the Kijun-sen line (twenty six-day moving average, green line) on almost all time frames. Since this move is not just a simple correction, buying gold at this point would simply be a very risky gambling.
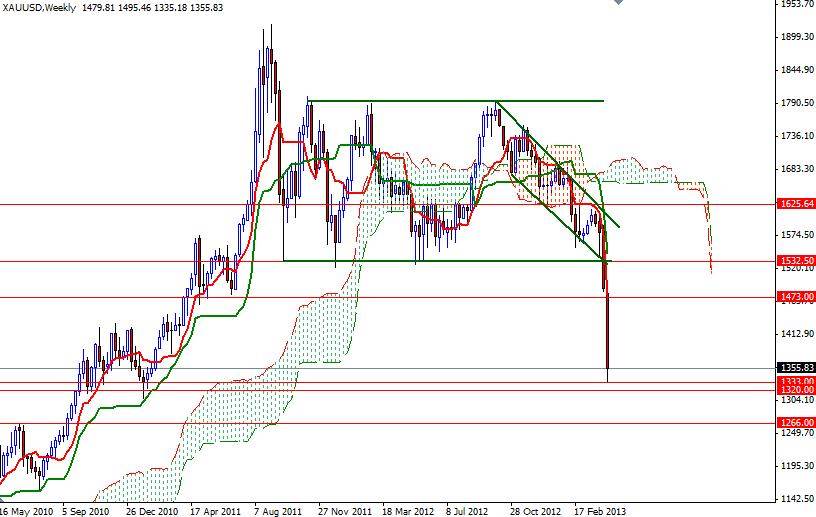
However, I will be watching the support zone between 1333 and 1320 levels today. This zone might be a place where the sellers would like to take some profit off the table. If that is the case, plenty of resistance can be found at 1371, 1381 and 1393. If we rally I will be looking for weakness to sell. A close below 1320 would make me think that we will be testing the 1308, 1296 and 1266 support levels next.
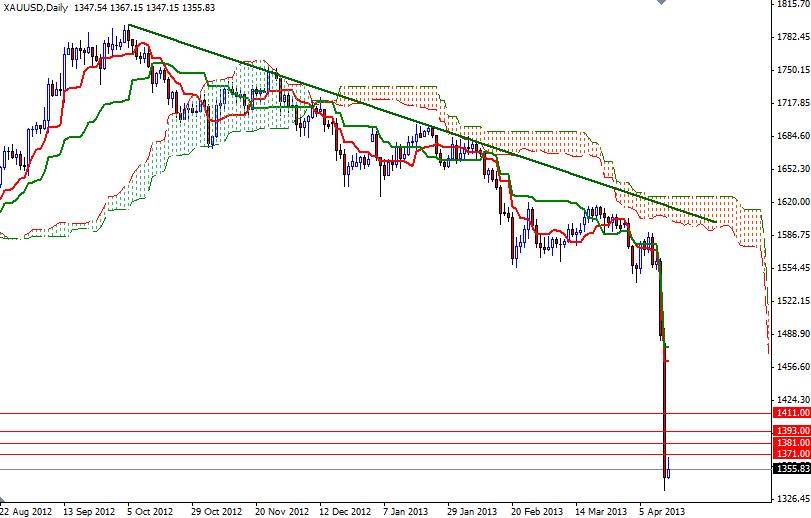
gold forescast


Gold witnessed the biggest one-day selloff in its history yesterday, plunging to record a low at 1320.00 level, before rebounding with the start of today’s session. The drop suggests that the sell-off could be exaggerated, and usually when we witness such sell-offs, it leads to major volatility where correctional bounces can be strong and lengthy. Accordingly, we will look to short the metal but at a higher price.


** Overall trend ( More than one year)
** Intermediate ( More than three months)
** Short term ( Less than three months)
** Chart is based on GMT+2 timing
Notes: 
*if price reaches within 20% from target before triggering entry, signal is canceled and not valid anymore.
Support1320.001308.001300.001285.001260.00
Resistance1385.001400.001425.001440.001458.00
RecommendationBased on the charts and explanations above, we prefer to short gold around 1385.00, targeting 1350.00 and 1325.00 Stop loss above 1400.00

Apr 15, 2013

gold forecast


Gold plunged, the yellow metal has lost its glitter falling aggressively to break the long-term support at 1525.00 level, and that resulted in a panic, sending the metal to levels near 1425.00, where price is currently testing the 200-weeks SMA. The technical structure has turned extremely bearish, as the long term bullish trend is starting to be damaged, and accordingly, rallies should be treated as new opportunities to short.


** Overall trend ( More than one year)
** Intermediate ( More than three months)
** Short term ( Less than three months)
** Chart is based on GMT+2 timing
Notes: 
*if price reaches within 20% from target before triggering entry, signal is canceled and not valid anymore.
Support1442.001432.001425.001410.001400.00
Resistance1462.001472.001480.001495.001500.000
RecommendationBased on the charts and explanations above, we prefer to short the metal below 1480.00 targeting 1430.00,1400.00. and 1380.00. Stop loss above 1510.00