SELL GOLD AROUND 1195
TAKE PROFIT 1187
For more detail Please Contact 092 749966,093 749966 lekchansour@gmail
TAKE PROFIT 1187
For more detail Please Contact 092 749966,093 749966 lekchansour@gmail

Gold edged higher with the beginning of 2015, and the upside move took it to trade above the resistance of the downside move and above Linear Regression Indicator 34, while trading above them is positive. In fact, trading above 1181.85 is positive this week and stabilizing above it triggers a new attempt to breach 1213.05 and move towards 1238.25 again.
From the downside, breaking 1181.85 and stabilizing below it pushes the price towards 1159.20 at least, and breaking this level gets the price into a new bearish wave that targets the previous bottom 1131.40. | |||||
Subscribe For Constant Updates!
Subscribe to the Technical Portal to continue to access the latest updates, market recommendations and a wide variety of technical reports Subscribe Now
| |||||
| Support | 1195.00 | 1190.00 | 1181.85 | 1168.00 | 1159.20 |
| Resistance | 1200.00 | 1205.00 | 1213.05 | 1220.00 | 1226.60 |
| Recommendation |
Positive expectations above 1195.00, risk-limit below 1180.00.
| ||||
 The metal remained limited above 1285.10 yesterday keeping the positive expectations. We notice today a negative crossover on Linear Regression Indicators which contradicts with the positivity of stabilizing above 1285.10. We depended yesterday on achieving higher lows, however, as the price is stable above 1277.00 - 1276.00 strengthening the possibility of a bullish wave. Therefore, we will benefit from the appropriate Risk/Reward Ratios to suggest an upside move for today with the same stop-loss and break 1277.00. As soon as the stop-loss is achieved we will become negative. Breaching and stabilizing above 1300.00 levels is significant to confirm positivity today and the upcoming period. | |||||
| Support | 1285.00 | 1280.00 | 1277.90 | 1272.00 | 1266.55 |
| Resistance | 1293.00 | 1296.60 | 1300.00 | 1305.00 | 1309.35 |
| Recommendation |
Based on the above, long gold at 1290.00, targeting 1296.00, 1330.00, then 1309.00, and stop-loss below 1276.00.
In case of stop-loss, selling gold below 1276.00 targeting 1266.00 and 1260.00 then 1250.00 with stop-loss above 1296.25 levels. | ||||

 The metal dropped sharply yesterday after failing to remain stable above 1309.35 and achieved the stop-losssuggested in yesterday's recommendation, but failed to break below 50% correction at 1285.00 showing on graph. The downside move is only a retest to the bearish resistance level that started from the top 1387.00; as the price is close to 50% correction, we will bet today on an upside move only by counting on stability above 1285.00 and the referred to bearish resistance that was previously breached. On the above graph, we notice higher lows supporting our decision today of becoming neutral despite achieving yesterday's stop-loss of our buying position, but we will place stop-loss at 1276.00 and we will reverse our expectations to negative if achieved. | |||||
| Support | 1285.00 | 1280.00 | 1277.90 | 1272.00 | 1266.55 |
| Resistance | 1293.00 | 1296.60 | 1300.00 | 1305.00 | 1309.35 |
| Recommendation |
Based on the above, long gold at 1290.00, targeting 1296.00, 1330.00, then 1309.00, and stop-loss below 1276.00.
In case of stop-loss, selling gold below 1276.00 targeting 1266.00 and 1260.00 then 1250.00 with stop-loss above 1296.25 levels. | ||||

 Yesterday's volatility remained limited above Linear Regression Indicator 55, as we witness today a new attempt to confirm stability above 1309.35 levels. The metal should stabilize above the mentioned level 1309.35 in order not to form bearish corrections especially that RSI 14 and MACD are showing weakness. Generally, trading above 1300.00 is positive today while the overall upside move depends on stability above 1277.00. Of note, resistance levels 1318.10 and 1324.35 could be strong, so the metal should break above these levels to extend the upside move. | |||||
| Support | 1309.35 | 1305.00 | 1300.00 | 1296.25 | 1293.00 |
| Resistance | 1318.10 | 1324.35 | 1331.50 | 1339.75 | 1348.40 |
| Recommendation |
Based on the above, long gold at 1309.35, targeting 1324.00, 1339.00, then 13487.00, and stop-loss below 1296.00.
| ||||
 On the four-hour graph, we notice a positive crossover on Linear Regression Indicators accompanied by trading around 1309.35 represented in 38.2% correction of the bullish wave that started from the bottom 1182.00 reaching the top 1387.00. Stability above 1300.00 is positive; but because RSI touched line 70 then dropped, the metal should stabilize above 1309.35 to keep the bullish bias without any corrections. Generally, stabilizing above 1277.00 keeps the bullish possibility valid, but stability above 1285.00 is required to strengthen this possibility.
For more detail Please Contract 092 749966, 093 749966 lekchansour@gmail | |||||||||||||||||||||||


| Support | 1358.00 | 1352.00 | 1346.00 | 1340.00 | 1333.00 |
| Resistance | 1368.00 | 1373.00 | 1380.00 | 1393.00 | 1400.00 |
| Recommendation | Long above 1352.00, targets at 1368.00, 1380.00 and 1400.00. Invalidation with four-hour closing below 1347.00. | ||||


Despite the negative pressures the pair witnessed yesterday, we find it stable above 1.3340 levels represented in 61.8% correction shown on graph. Stability above 1.3340 keeps our expectations positive,as we think the pair might face a bullish wave today. The pair is targeting 1.3505 levels for a start, and stability above 1.3225 keeps these expectations during the upcoming period.
The trading range for today is among the key support at 1.3225 and key resistance at 1.3505.
The general trend over short term basis is to the upside targeting 1.3600 as far as areas of 1.2970 remains intact.
| |||||
| Support | 1.3340 | 1.3310 | 1.3270 | 1.3225 | 1.3170 |
| Resistance | 1.3385 | 1.3440 | 1.3485 | 1.3505 | 1.3545 |
| Recommendation |
Based on the charts and explanations above, our opinion is buying the pair above 1.3340 targeting 1.3385, 1.3440 then 1.3505 and stop-loss with four-hour closing below 1.3270 might be appropriate
| ||||
Short Term trend: Bearish
Intraday Bias: Bearsih

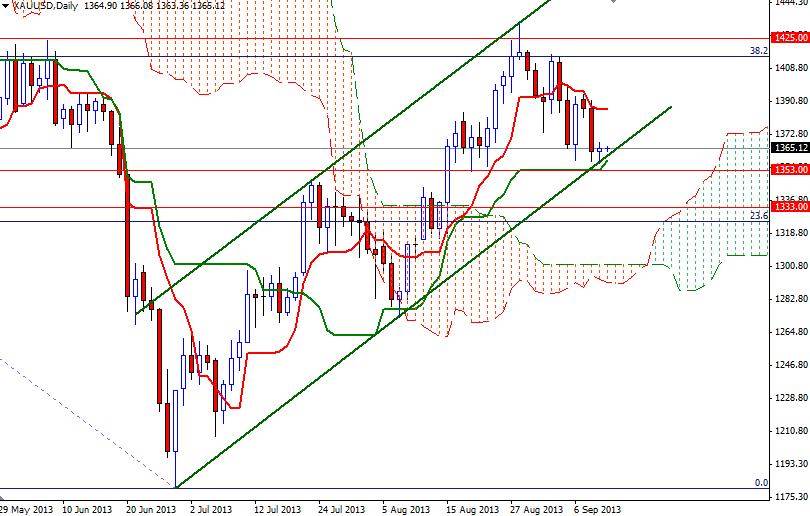
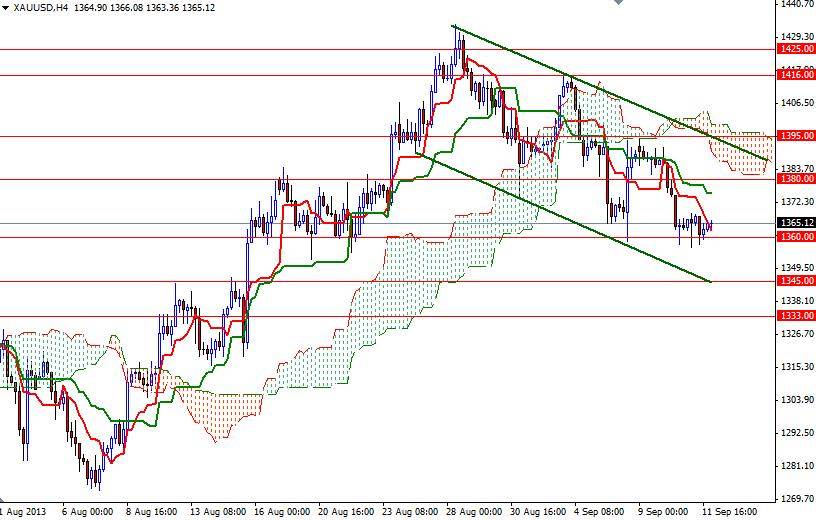
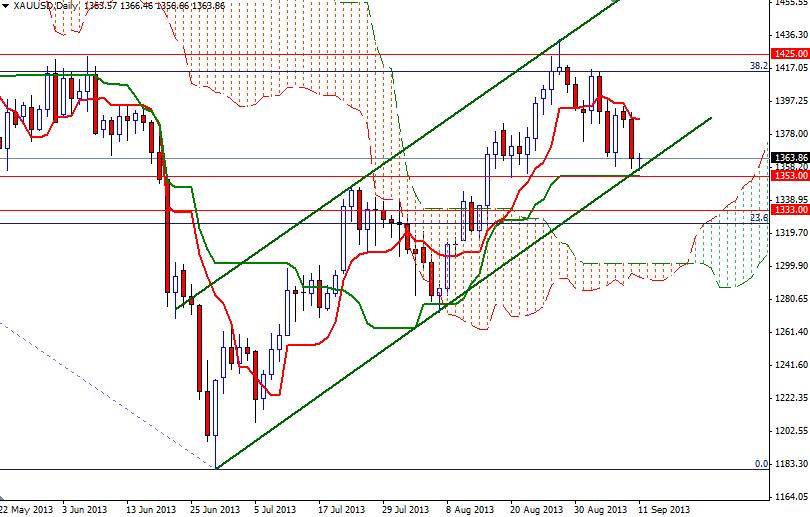
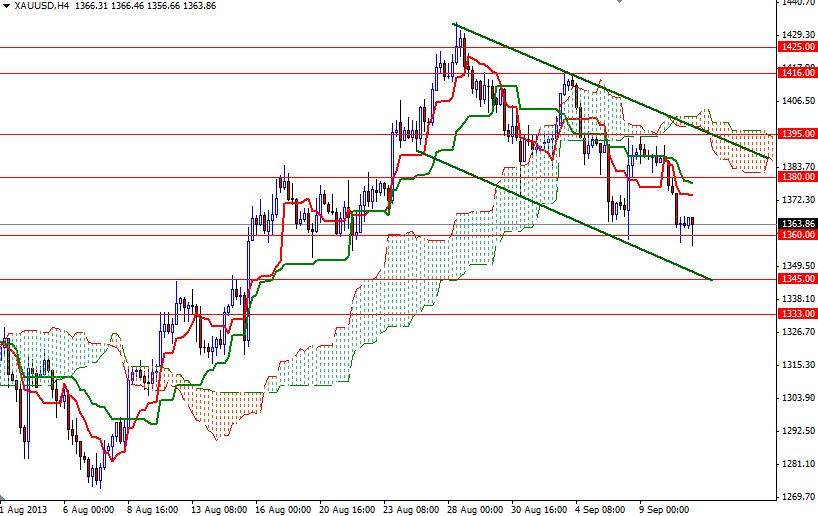
Gold has been trapped within a very narrow range this week and seems that the market is preparing for a huge move over upcoming sessions. RSI 14 remains stable below the value of 50.00, suggesting potential downside movements. A break below 1466.00-FE 38.2%- of the above seen wave to confirm our bearish scenario. On the upside, only a break above 1425.00 will negate.
** Short term (Less than three months)
** Chart is based on GMT+2 timing
Notes:
*if price reaches within 20% from target before triggering entry, signal is canceled and not valid anymore. | |||||
| Support | 1380.00 | 1373.00 | 1366.00 | 1363.00 | 1360.00 |
| Resistance | 1395.00 | 1400.00 | 1414.00 | 1425.00 | 1437.00 |
| Recommendation | Based on the chart and explanations above, sell gold below 1400.00 targeting 1330.00 and stop loss above 1425.00 could be appropriate | ||||
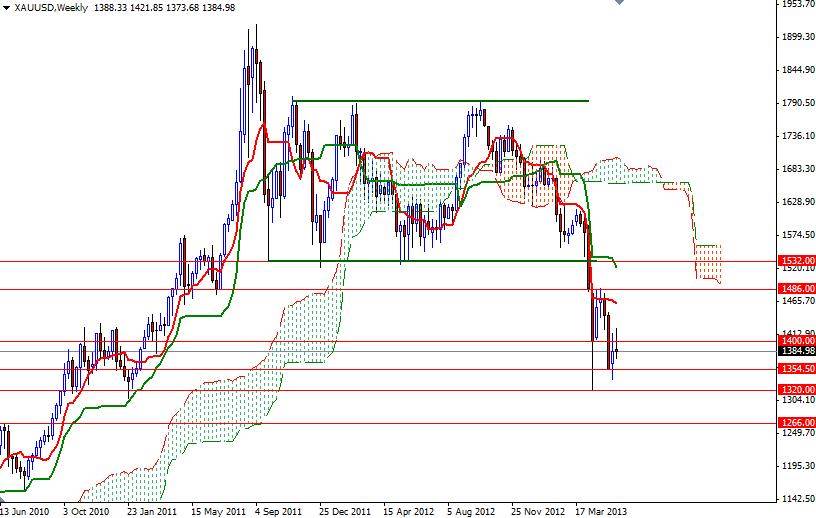 សប្តាហ៍នេះខ្ញុំគិតថា 1400 និង 1372,50 នឹងកម្រិតសំខាន់ដទៃទៀតដើម្បីមើល។ បើទោះបីជាការរួមបញ្ចូលគ្នានៃកត្តាគាំទ្រមាសដូចជាការទិញដោយធនាគារកណ្តាលនិងតម្រូវការកើនឡើងសម្រាប់មាសរាងកាយមួយដែលខ្ញុំនឹងត្រូវបានយកចិត្តទុកដាក់បន្ថែមទៀតដើម្បីបង់តារាង។ ក្នុងពេលតំណាលគ្នានេះដែរខ្ញុំក៏នឹងរក្សាភ្នែកនៅលើផែដុ្លរ / JPY និងភាគហ៊ុនរបស់សហរដ្ឋអាមេរិក។ ប្រសិនបើការលក់បង្កើនល្បឿនវិនិយោគិនអាចនឹងបោះបង់ចោលការស្តុកនិងនាំគ្នាទៅជាមាស។ ប្រសិនបើគូនេះបានដោយជោគជ័យទម្លាក់ខាងក្រោម 1372,50 វានឹងបន្តនៅភ្ញាក់ផ្អើលដែលអតិថិជន bearish និងសាកល្បងកម្រិតការគាំទ្រ 1360 ។ បិទប្រចាំសប្តាហ៍ខាងក្រោម 1354,50 មានន័យថា 1338 និង 1320 នឹងគោលដៅនៅពេលបន្ទាប់។ ប្រសិនបើ Bull បានគ្រប់គ្រងដើម្បីជំរុញឱ្យតម្លៃកើនឡើងមកវិញហើយបិទខាងលើ 1400 មានកម្រិតយើងប្រហែលជាអាចមើលឃើញជាបន្តសុទិដ្ឋិនិយមដែលផ្ដោតសំខាន់ទៅ 1442 យ៉ាងហោចណាស់។ ទោះយ៉ាងណាបើថាគឺជាករណីដែលរំពឹងថានឹងមើលឃើញថាការតស៊ូនៅ 1411/3 និង 1430 ។
