Sep 17, 2013

test

Hi for test only
For more detail Please Contact
 092 749966,093 749966
 lekchansour@gmail

Sep 12, 2013

Gold Price Analysis Sept. 12, 2013

The gold market appears to be stable with the bulls and bears gaining and losing ground almost equally during the Asian session. On Wednesday the XAU/USD pair had a slightly bullish session as the American dollar weakened across the board. Although the pair bounced off of the bottom of the ascending trade channel which the market has been respecting over the last 12 weeks, the lack of strong momentum will certainly be something to watch.
Recently, gold prices have been under the pressure on reduced likelihood of a U.S. military action against Syria. In the meantime, the markets are still waiting to see how the Federal Reserve will react to the changes in the economy and how U.S. politicians deal with the debt ceiling issue. The reduction of asset purchases may be the catalyst that the bears need to push gold prices lower but this could also lead some investors to shift money from equities to gold.
At this point, I think most traders will be reluctant to take sizable positions, long or short. From a technical point of view, trading above the Ichimoku cloud on the daily chart suggests the bulls still have an advantage over the medium term.
XAUUSD Daily 91213
However, the XAU/USD pair is trading below the Ichimoku cloud on the 4-hour time frame and we have bearish Tenkan-sen (nine-period moving average, red line) - Kijun-sen (twenty six-day moving average, green line) cross. Because of that, if the 1353 support level is breached, it is probable that prices will continue to grind lower. If that is the case, expect to see support at 1345, 1333 and 1324. To the upside, the 1380 and 1395 levels where the Ichimoku cloud resides will be the first critical barrier for the pair. The bulls will have to break and hold above the 1400 level in order to gain enough traction to challenge the bears at 1416 and 1425.
XAUUSD 4hr 91213
For more detail Please Contact
 092 749966,093 749966
 lekchansour@gmail

Gold forecast 12/09/13

Gold is retesting the rising trend line for the overall short-term bullish trend, in addition to the key horizontal support region that start from 1358.00 to 1347.00; we mentioned earlier that this might be the last defense for the ongoing bullish trend, as breaking below it may signal the resumption of the medium term bearish trend. Technically, we should maintain the bullish view so long as this area is holding.

Support1358.001352.001346.001340.001333.00
Resistance1368.001373.001380.001393.001400.00
RecommendationLong above 1352.00, targets at 1368.00, 1380.00 and 1400.00. Invalidation with four-hour closing below 1347.00.
For more detail Please Contact
 092 749966,
093 749966 

gold forecast

Gold prices (XAU/USD) settled lower yesterday on easing Syrian tensions and speculations the Federal Reserve will adjust the pace of monthly asset purchases based on improvement in the economic outlook (currently the Fed purchases longer-term treasury securities at a pace of $45 billion per month and mortgage-backed securities at a pace of $40 billion per month).
After breaking below the 1380 support level, the XAU/USD pair hit the lowest level since August 22. The pair is currently trading at 1363.86 and it seems that the bears are getting ready to tackle 1353 and 1345 support levels. However, looking at the daily chart from a purely technical point of view, the odds favor a bit of a bounce at this point because the bottom line of the ascending channel which the pair has been following for almost 12 weeks sits here.
XAUUSD Daily 91113
If the bulls successfully hold the pair inside the ascending channel and prices reverse, expect to see resistance at the 1380 and 1395 levels which defines the borders of the Ichimoku cloud on the 4-hour time frame. I think that climbing above the 1400 level would lure some investors back to the market and increase the possibility of a bullish attempt to revisit the 1416 – 1425 resistance area. If the bears want to dominate the market, they will have to pull prices below the 1345 level on a daily basis. In that case, I would be looking for 1333 and 1324 which happens to be the Fibonacci 23.6 retracement based on the bearish run from 1795.75 to 1180.21.
XAUUSD 4hr 91113

Gold forecast

Midday update for Gold 11/09/2013
 
The tight range keeps controlling gold trading since morning, which remains fluctuating near the bullish channel support, which makes us keep our waited bullish trend expectations, where achieving it conditioned by holding above 1358.00

Expected trading range for today is between: 1340.00 support and 1400.00 resistance.

Expected trend for today: Bullish

Jul 16, 2013

Gold Technicals – Higher on speculative demand

Gold Technicals – Higher on speculative demand

 \ 1:17 AM EDT \ July 15th, 2013
Gold recorded the biggest weekly gain since October 2011, thanks to Ben Bernanke’s speech on Wednesday following the release of FOMC Meeting Minutes, telling markets that QE3 will be here to stay for the “foreseeable future”. This propelled Gold higher, as USD weakened significantly following the news, allowing the yellow metal to push above the 1,200 USD per ounce level which happens to be the cost price for mining and refining gold currently. Besides fundamental reasons which favor a slightly more expensive Gold, Hedge Funds were also seen buying more Gold last week after the news, suggesting that speculators are getting back in the game. CFTC Commitment of Trader latest data shows speculators increasing their net-long position by 4.1% for Gold Futures and Options, affirming the reports about Hedge Funds. It is also important to note that the numbers released pertain to 9th July data, which is 1 day before Bernanke’s speech. Putting 2 and 2 together, it stands to reason to believe that current speculative long positions should be even higher.
Weekly Chart
http://forexblog.oanda.com/mserve/XAUUSD_150713W1Retry.PNG
From a technical perspective, we are looking at a potential bullish reversal Candlestick pattern – with a Morning Star bullish pattern formed on the weekly chart. Early Asian trade saw prices extending last week’s gain slightly, moving price back up towards the 1,300 – 1,330 resistance. Stochastic readings are also on the verge of signalling a strong bull cycle sign, suggesting that a move upwards is likely, and may even allow price to break the aforementioned resistance band for a test of the descending Channel Bottom (purple color). This would also mean that a break of current steeper decline, which would allow price to alleviate current strong bearish pressure – potentially allow price to trade horizontally for a few weeks similar to what we’ve seen in April (post decline) and June 2013.
Hourly Chart
http://forexblog.oanda.com/mserve/XAUUSD_150713H1Retry.PNG
Hourly Chart is currently above the 1,289 ceiling which will provide some support. Even should price break lower, it is possible that support can be sought from the Kumo, and below which the rising trendline. Forward Kumo is also bullish with a recent bullish “Kumo Twist” which occurred just a few hours prior in conjunction with the break of 1,289 ceiling, suggesting that a retest towards 1,299 last week’s swing high is possible. Stochastic readings are currently Overbought, but readings have averted a bearish cycle signal with readings currently pointing higher, suggesting that an interim trough has been in place within the Overbought levels. Furthermore, considering that longer-term trend is gaining bullish momentum, it is possible that short-term counter-trend signals are less effective given such situation.
Moving forward, we should keep a keen lookout for this Friday’s COT numbers for both Gold Futures and Gold Physical. Should net position continue to gain, then this would mean that Hedge Funds are buying AND holding, which will put prices in a much better position for a longer bullish correction higher. If speculative net-long positions decrease, then we should discount the Hedge Fund buying news as it would appear that these buyers are simply buying for the short-term dead cat bounce, which puts the recovery towards 1,300 and higher in doubt

Jun 26, 2013

26/06

ទីផ្សារមាសបានធ្លាក់អស់គ្រាន់តែបន្ដិចក្នុងអំឡុងសម័យកាលពីថ្ងៃអង្គារប៉ុន្តែនៅតែមានសារៈសំខាន់របស់ផ្ទះមាន។ យើងជឿថាយើងស្ថិតនៅក្នុងតំបន់មួយដែលនៅពេលនោះគួរតែផ្ដល់នូវប៊ីតនៃការគាំទ្រដែរ។ Nonetheless យើងពេញចិត្តនឹងការលក់ប្រមូលផ្តុំគ្នាទៅមុខជាពិសេសនៅជុំវិញកម្រិត $ 1350 ដូចដែលវាត្រូវបានមើលទៅភាពធន់ទ្រាំយ៉ាងសំខាន់នៅពេលនេះ។ ជម្មើសជំនួសយើងជឿជាក់ថាទីផ្សារមាសនឹងទៅខ្ពស់ជាងនេះច្រើនប៉ុន្តែវាមិនបាន bottomed ចេញនៅឡើយទេហើយជាលទ្ធផលមួយដែលយើងជាធម្មតាមិនទិញវានោះទេ។ យើងគិតថាមានប្រហែលខ្ពស់ដែលនឹងមានជាច្រើនរយៈពេលខ្លីនៅក្នុងឱកាសការលក់នាពេលអនាគតដ៏ខ្លីខាងមុខបើទោះបីជា។

Jun 24, 2013

24.06.13

Please kindly to find my attached file of  Gold Trading Strategy from Organizations on 24th June 2013.
យុទ្ធសាស្រ្ត​ជួញដូរ​មាស​សម្រាប់​អង្គភាព​ 24/06/2013
យុទ្ធសាស្រ្ត​ជួញដូរ​មាស​សម្រាប់​អង្គភាព​​ក្រៅ​ស្រុក
1.   Action Forex
យុទ្ធសាស្រ្ត​ចម្បង: លក់​នៅ​ខាង​ក្រោម​តម្លៃ 1326, កំណត់​ការ​ចំណេញ(take profit): 1270 - 1244
យុទ្ធសាស្រ្ត​បន្ទាប់​: ទិញ​នៅ​ខាង​លើតម្លៃ 1326, កំណត់​ការ​ចំណេញ(take profit): 1351 - 1375

2. Kitco
លក់​នៅ​ខាង​ក្រោម​តម្លៃ:1298, កំណត់​ការ​ខាត(stop loss):1303, កំណត់​ការ​ចំណេញ(take profit): 1280
យុទ្ធសាស្រ្ត​ជួញដូរ​មាស​សម្រាប់​អង្គភាព​​ក្នុង​​ស្រុក
1. VGTA
ទិញ​នៅ​ចន្លោះ 1285-1290, កំណត់​
ចំណេញ(stop loss):1300, កំណត់​ការ​ខាត​(take profit): 1280
2. VGI
លក់​នៅ​ចន្លោះ: 1298 - 1300, កំណត់​ការ​ខាត(stop loss):1307, កំណត់​ការ​ចំណេញ(take profit): 1289

3. IGI
ទិញ​នៅ​ចន្លោះ 1285-1290, កំណត់​ការ​ចំណេញ(take profit): 1306, កំណត់​ការ​ខាត(stop loss):1283

Jun 14, 2013

EUR/USD -

News Date: 14/6/2013 06:03:41


Despite the negative pressures the pair witnessed yesterday, we find it stable above 1.3340 levels represented in 61.8% correction shown on graph. Stability above 1.3340 keeps our expectations positive,as we think the pair might face a bullish wave today. The pair is targeting 1.3505 levels for a start, and stability above 1.3225 keeps these expectations during the upcoming period.
The trading range for today is among the key support at 1.3225 and key resistance at 1.3505.
The general trend over short term basis is to the upside targeting 1.3600 as far as areas of 1.2970 remains intact.
Support1.33401.33101.32701.32251.3170
Resistance1.33851.34401.34851.35051.3545
Recommendation
Based on the charts and explanations above, our opinion is buying the pair above 1.3340 targeting 1.3385, 1.3440 then 1.3505 and stop-loss with four-hour closing below 1.3270 might be appropriate

14.06.13

Short Term trend: Bearish
Intraday Bias: Bearsih


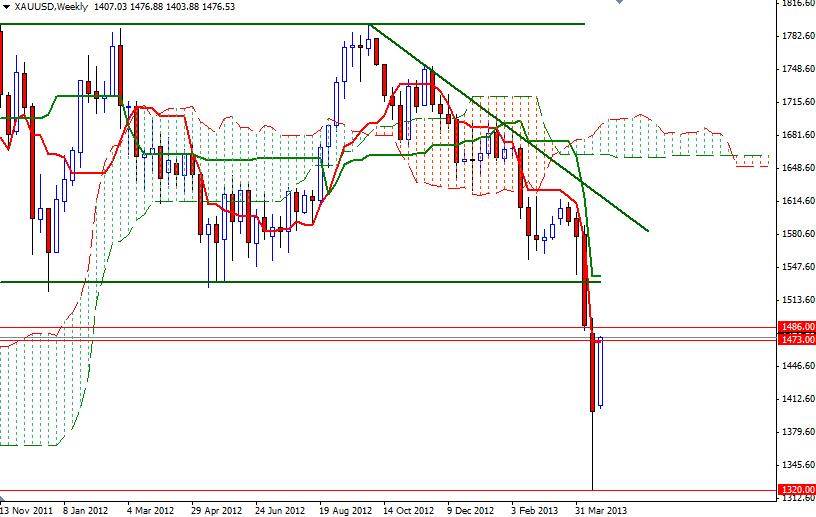
Gold has been trapped within a very narrow range this week and seems that the market is preparing for a huge move over upcoming sessions. RSI 14 remains stable below the value of 50.00, suggesting potential downside movements. A break below 1466.00-FE 38.2%- of the above seen wave to confirm our bearish scenario. On the upside, only a break above 1425.00 will negate.
** Short term (Less than three months)
** Chart is based on GMT+2 timing
Notes: 
*if price reaches within 20% from target before triggering entry, signal is canceled and not valid anymore.
Support1380.001373.001366.001363.001360.00
Resistance1395.001400.001414.001425.001437.00
RecommendationBased on the chart and explanations above, sell gold below 1400.00 targeting 1330.00 and stop loss above 1425.00 could be appropriate

Jun 3, 2013

daily forecast

 បានបញ្ចប់សប្តាហ៍បន្ទាប់ពីការចុះទាបជាងតម្លៃកាលពីថ្ងៃសុក្រសកម្មភាពរបស់ bearish ។ តម្លៃមាសឡើងថ្លៃបានធ្លាក់ចុះយ៉ាងខ្លាំងនៅថ្ងៃចុងក្រោយនៃការធ្វើពាណិជ្ជកម្មមួយសប្តាហ៍និងខែបន្ទាប់ពីទិន្នន័យសេដ្ឋកិច្ចដែលបានចេញផ្សាយពីសហរដ្ឋអាមេរិកបានផ្តល់ភស្តុតាងបន្ថែមទៀតថាសេដ្ឋកិច្ចដ៏ធំបំផុតរបស់ពិភពលោកកំពុងបន្តទៅងើបឡើងវិញ។ លេខចុងក្រោយបំផុតបង្ហាញថាសាកលវិទ្យាល័យ Michigan បានសន្ទស្សន៍វេទនាអតិថិជនបានកើនឡើងដល់ 84,5 ពី 76.4 ខែមុននិងក្រុង Chicago PMI បានកើនឡើងដល់ 58.7 នៅក្នុងខែឧសភាពី 49 នៅក្នុងខែមេសា។ បើយោងទៅតាមទាយជ្ជទាននៃរបាយការណ៍អាជីវករបានចេញផ្សាយដោយគណៈកម្មការជួញដូរទំនិញនាពេលអនាគតក្រុមអាជីវករប្រថុយប្រថានបន្តទៀតដើម្បីបង្កើនមុខតំណែងខ្លីរបស់ពួកគេ។ ទិន្នន័យកាលពីថ្ងៃសុក្ររបស់ stoked ប៉ាន់ប្រមាណថាសហព័ន្ធបម្រុងអាចបន្ថយទិញទ្រព្យសម្បត្តិរបស់ខ្លួននៅក្នុងប៉ុន្មានខែខាងមុខនិង bears បានប្រើឱកាសនេះដើម្បីបង្កើនសម្ពាធលក់និងតម្លៃអូសខាងក្រោម 1400 កម្រិត។ កម្រិតនេះត្រូវបានលំងជាមុន Bull ដែល 'សម្រាប់ពេលខ្លះហើយវាប្រហែលជានៅតែបន្តធ្វើដូច្នេះ។ ទៀនប្រចាំសប្តាហ៍បានបង្ហាញថាតម្លៃខ្ពស់ជាងនេះត្រូវបានច្រានចោលដោយឈ្មួញ។ នៅលើតារាងប្រចាំសប្តាហ៍និងប្រចាំថ្ងៃនេះគូ XAU / ដុលា្លារនៅតែខាងក្រោមពពក Ichimoku ហើយយើងមាន bearish Tenkan-សែន (ប្រាំបួន-period ការផ្លាស់ប្តូរមធ្យមបន្ទាត់ពណ៌ក្រហម) - Kijun-សែន (ម្ភៃប្រាំមួយថ្ងៃជាមធ្យមការផ្លាស់ទីបន្ទាត់ពណ៌បៃតង) crosses បង្ហាញថាទស្សនវិស័យរយៈពេលវែងគឺនៅតែមាន bearish ។
សប្តាហ៍នេះខ្ញុំគិតថា 1400 និង 1372,50 នឹងកម្រិតសំខាន់ដទៃទៀតដើម្បីមើល។ បើទោះបីជាការរួមបញ្ចូលគ្នានៃកត្តាគាំទ្រមាសដូចជាការទិញដោយធនាគារកណ្តាលនិងតម្រូវការកើនឡើងសម្រាប់មាសរាងកាយមួយដែលខ្ញុំនឹងត្រូវបានយកចិត្តទុកដាក់បន្ថែមទៀតដើម្បីបង់តារាង។ ក្នុងពេលតំណាលគ្នានេះដែរខ្ញុំក៏នឹងរក្សាភ្នែកនៅលើផែដុ្លរ / JPY និងភាគហ៊ុនរបស់សហរដ្ឋអាមេរិក។ ប្រសិនបើការលក់បង្កើនល្បឿនវិនិយោគិនអាចនឹងបោះបង់ចោលការស្តុកនិងនាំគ្នាទៅជាមាស។ ប្រសិនបើគូនេះបានដោយជោគជ័យទម្លាក់ខាងក្រោម 1372,50 វានឹងបន្តនៅភ្ញាក់ផ្អើលដែលអតិថិជន bearish និងសាកល្បងកម្រិតការគាំទ្រ 1360 ។ បិទប្រចាំសប្តាហ៍ខាងក្រោម 1354,50 មានន័យថា 1338 និង 1320 នឹងគោលដៅនៅពេលបន្ទាប់។ ប្រសិនបើ Bull បានគ្រប់គ្រងដើម្បីជំរុញឱ្យតម្លៃកើនឡើងមកវិញហើយបិទខាងលើ 1400 មានកម្រិតយើងប្រហែលជាអាចមើលឃើញជាបន្តសុទិដ្ឋិនិយមដែលផ្ដោតសំខាន់ទៅ 1442 យ៉ាងហោចណាស់។ ទោះយ៉ាងណាបើថាគឺជាករណីដែលរំពឹងថានឹងមើលឃើញថាការតស៊ូនៅ 1411/3 និង 1430 ។

May 30, 2013

gold FORECAST

Short Term trend: Bearish
Intraday Bias: Bullish
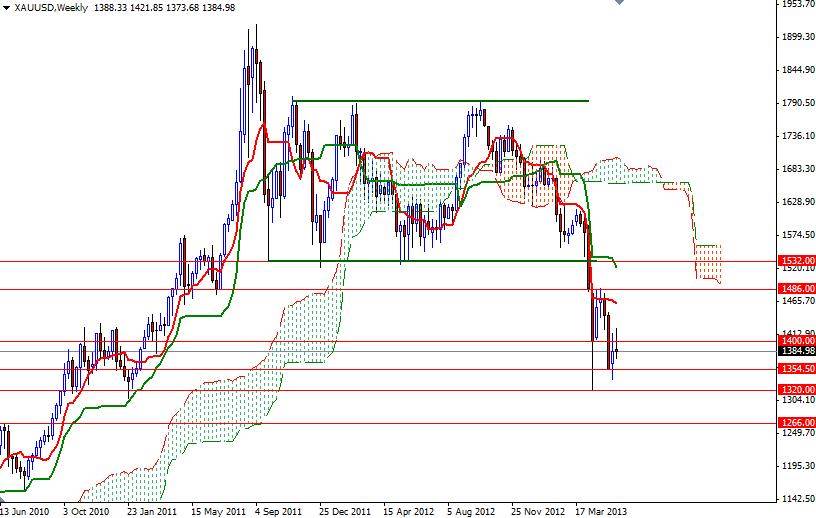
Gold is penetrating 1400.00 key resistance level, which is the resistance of the recent consolidation period, stability above the level signals further upside potentially towards 1440.00-1450.00 next resistance level. Accordingly, we would like to see price hold above the level for few hours to expect an upside move.

** Short term (Less than three months)
** Chart is based on GMT+2 timing
Notes: 
*if price reaches within 20% from target before triggering entry, signal is canceled and not valid anymore.
Support1378.001360.001340.001321.001310.00
Resistance1400.001410.001419.001425.001445.00
RecommendationBased on the charts and explanations above, we prefer to long gold after a four-hour closing above 1400.00 targeting 1420.00 and 1445.00. Stop loss below 1388.00

Can 1976 Give Us Insight Into Gold's Price Behavior?

Can 1976 Give Us Insight Into Gold's Price Behavior?

MAY 28, 2013, 6:48 AM
Based on the May 24th, 2013 Premium Update.
The Wall Street Journal ran a piece delineating the two sides of the gold debate giving five reasons why the gold bulls are right and five reasons why the gold bears are right.
Here is the 5-point gold “Bull” case:
  1. Fears that Cyprus may sell its gold have receded.
  2. The exuberance in the equities market will fade as soon as there is a major correction and investors will turn to gold.
  3. The monsoon season in India will end, the marriage season will begin and with it the traditional gold buying frenzy which will contribute to long-term demand.
  4. Banks in India count gold as part of the bank’s liquid ratio. As the asset base of banks will grow, so will demand for gold.
  5. Physical demand for gold is high.
We added a few more reasons that they didn’t think of.
  1. Central banks in various countries are buying the dollar to lower the value of their own currencies. That’s a currency war.
  2. Central banks are still net buyers of gold and we don’t see any signs of abatement.
  3. Central banks are flooding more and more fiat money into the system. The more they do, the more it loses its value. Gold cannot be printed and there is a limited amount that can be mined each year. Gold is money.
  4. Owning gold isn’t necessarily about buying low and selling high. Sometimes, it is about owning a long-term insurance policy.
  5. We don’t see a balanced budget in sight. We are not buying the economic recovery and the “recession is over” story.
Here are the five-point “Bear” case.
  1. The U.S. Fed could cut the stimulus sooner than later.
  2. Investor sentiment for gold is poor, to say the least.
  3. The U.S. dollar is strong which dampens gold’s appeal for other currency holders.
  4. Indian gold demand faces risks in the near term before the wedding season begins.
  5. There could be further liquidations of gold ETFs.
Regarding the first point, comments from Ben Bernanke to Congress last week suggested the central bank may begin tapering its bond-buying program in coming months. On Wednesday morning, stocks had rallied after the release of Bernanke’s prepared remarks, in which he said that premature tightening in policy could strangle the economic recovery. However, in the question-and-answer session, Bernanke said the Fed could slow the pace of asset purchases in the “next few meetings.” That comment sent the markets gyrating downwards making for a volatile and interesting day for precious metals. The sector moved slightly higher, then soared, stayed high for several minutes and then crashed with stocks following more or less the same path. The USD Index did the opposite. The Fed’s bond-buying program is one of the major factors underpinning the stock rally. There is no denying that there was a time when it directly helped gold. In Thursday early trading gold bounced back as the dollar fell sharply and European shares dropped after weak Chinese factory activity added to concerns about a delayed recovery. According to the Market Watch report, Thursday saw safe haven gold buying, something the yellow metal has not experienced in a while.
China manufacturing data issued Thursday came in weaker than expected, which is bearish for commodities. The fact that gold rallied in the face of this news suggests there was “solid safe-haven demand for gold Thursday,” according to MarketWatch.
Last month’s savaging of the gold price no doubt has left new gold investors shaken. But the reasons that led to the bull market in gold have not changed. If anything they are stronger than ever. Unless governments suddenly start balancing budgets, or unless central bankers suddenly stop printing money, there is definitely a good case for those who side with the gold bulls. But as of now, Japan and the US have embarked on a record quantitative easing policy. The speculators have been shaken out and gold has moved into stronger hands who have been buying up the physical kind to keep and to hold.
We think that the gold bull market will resume its upward trajectory shortly. It is, however, vulnerable to further weakness in the short run.
Having discussed gold’s fundamentals, let’s move on to today’s chart section to see how the technical picture of the yellow metal looks like. We will start with the very long-term chart (charts courtesy by http://stockcharts.com.)
Very long-term Gold price chart
Gold prices moved higher last week but from the long-term perspective the rally is really not significant. It is barely visible here as it seems to simply be the expected period of consolidation which we have written about in the May 20 Market Alert we sent to our subscribers:
[in 1976] there was a pullback in gold before it moved below the initial low. We could see this type of action shortly. If silver and mining stocks consolidate below their previous lows it will simply serve as a confirmation of the breakdown and an indication of further declines.
The very long-term cyclical turning point is now quite close and it still seems that a bottom will be formed relatively soon but it is not necessarily in just yet. The reverse parabola trading pattern remains, so the possibility of a sharp drop in price is still in place for the yellow metal. The next support level, the 38.2% Fibonacci retracement level is around $1,285 and could be close to the level where the bottom finally forms, but a sharp intra-day or intra-week drop below it, would not surprise us either.
Now let us have a look at two important ratios that show gold’s performance relative to other important groups of assets. The first one is the Dow to gold ratio chart which is a proxy for a ‘stocks to gold’ ratio.
Dow to gold ratio chart - INDU:GOLD
Little has changed in this ratio last week and it seems that the comments we made in last week’s essay remain up-to-date:
Here, we saw an important breakout above the declining long-term resistance line. This has bearish implications for gold. (…) The next resistance level for this ratio is at 12.5 and with it currently at 11, declines in gold will surely be needed in addition to higher stock prices in order for the ratio to move this much higher (it seems that a move higher in the general stock market will not be enough for the ratio to move that high soon). The implications are, of course, bearish.
The second important ratio that we’d like to discuss today is the gold to bonds ratio. Let’s have a look then.
Gold to bonds ratio chart - GOLD:DJCB
In this another important ratio for gold, some strength was seen last week. Overall, however, this is not enough to change the outlook at this time and the short-term trend remains down. The next support line is the 61.8% Fibonacci retracement level, at 3.79, more than one-half a point lower than Thursday’s closing ratio level of 4.31. This is also equal to the level of the 2008 bottoms in terms of the closing prices.
Summing up, last week a pause was seen in the decline around the level of gold’s previous bottom. This is what we expected as it is very similar to what was seen way back in 1976. History does seem to rhyme here and since back then a bigger decline followed this type of move, we expect to see the same once again.
Thank you for reading. If you'd like to say updated on a daily basis through our Market Alerts, please subscribe.
Sincerely,

May 27, 2013

27.05.2013

IMMS-យុទ្ធសាស្រ្ត​មាស 27/05/13
កាល​ពី​សប្តាហ៍​មុន ​វគ្គ​ជួ​ញ​ដូរ​មាសនៅ U.S មាន​ការ​ប្រែ​ប្រួល​ដោយ​មិន​បាន​លើស​ចំណុច resistance តម្លៃ $1400/Oz
លទ្ធ​ផល​នៃ​ស្ថិរ​ភាព​ពិភព​លោក​ និង​កំណើន​ទីផ្សារ​ភាគ​ហ៊ុន​នោះ មាស​បាន​បាត់​បង់​ការ​ប្រ​កួត​ប្រ​ជែង​ និង​បន្ត​អោយ​មាន​ភាព​ច្របូក​ច្របល់។​ ក្រៅ​ពី​នេះ អ្នក​វិនិយោគិន​មាន​ការ​ស្ទាក់​ស្ទើរ​ មុន​ពេល​ការ​សំរេច​ចិត្តលើ​គោល​នយោបាយ​រូបិយ​វត្ថុ​របស់ Fed។​
ពេល​ឥលូវ​នេះ​ ទីផ្សារអា​មេរិក និង អ៊ឺរ៉ុបនឹង​ត្រូវ​បាន​បិទ​​សម្រាប់​ថ្ងៃ​ឈប់​សម្រាក Spring Bank និង Memorial Day ដូច​នេះតម្លៃ​មាស​មាន​ការ​​ប្រែ​ប្រួល​បន្តិច​បន្តួចទេ។
យុទ្ធសាស្រ្ត​ពិគ្រោះ:
លក់:  1390,  យក​ចំណេញ: 1377 - 1380  បញ្ឈប់​ការ​ខាត: 1393 
ទិញ 1376 យក​ចំណេញ1398 - 1415 បញ្ឈប់​ការ​ខាត1373

May 23, 2013

Gold forecast

Short Term trend: Bearish
Intraday: Bullish

Gold dipped towards the initial support at 1360.00, but failed to break it to rebound again, completing a double bottom over the hourly time interval, and thus we expect the rebound to continue, targeting initially 1400.00 resistance, on a break above 1400.00, we would add to our longs targeting 1445.00 area.
** Short term (Less than three months)
** Chart is based on GMT+2 timing
Notes: 
*if price reaches within 20% from target before triggering entry, signal is canceled and not valid anymore.
Support1360.001340.001321.001310.001300.00
Resistance1400.001410.001419.001425.001445.00
RecommendationBased on the charts and explanations above, we prefer to long gold above 1369.00 targeting 1390.00 and 1400.00. Stop loss with hourly closing below 1360.00

May 21, 2013

21 05 2013

Gold: upward trend.


Pivot: 1363.
Gold Strategy: Buy 1363.
+ Take Profit: 1407 & 1419.
+ Stop loss: 1336.


ទិញ: 1370, កំណត់ប្រាក់ចំណេញ: 1415, កំណត់ប្រាក់ខាត: 1360

May 15, 2013

15.05.2013

Gold: down trend.

Pivot: 1441.
Gold Strategy: sell below 1441.
+ Take Profit: 1419 & 1404.
+ Stop loss: 1449


May 10, 2013

gold strategy

Buy 1445-1447, take profit 1462, stop loss 1440

Sell 1476, take profit 1452, stop loss 1483

Today is nearly weekend, investors should order “stop loss” trading. 

Wish you have successful trading !
IMMS
New strategy
GOLD (Spot) intraday: the downside prevails. 
Pivot: 1478.00

Our preference: SHORT positions below 1478 with 1450 & 1441 in sight.

Alternative scenario: The upside penetration of 1478 will call for 1488 & 1507.

Comment: the RSI advocates for further downside.

Trend: ST Bearish; MT Bearish

Key levels Comment

1507** Intraday resistance
1488*** Previous high
1478** Intraday pivot point
1457.05 Last
1450** Intraday support
1441** Intraday support
1430**Previous low

GOLD (Spot) intraday: the downside prevails.

May 9, 2013

Trading central

Gold: upward trend.

Pivot: 1463.
Gold Strategy: Buy on the 1463.
+ Take Profit: 1478 & 1488.
+ Stop loss 1450.

Apr 30, 2013

ទីផ្សារមាសបានស្ងប់ស្ងាត់


ទីផ្សារមាសបានស្ងប់ស្ងាត់សម័យទំនាក់ទំនងនោះបន្ទាប់ពី gapping ខ្ពស់ជាងនេះនៅបើកចំហនៅថ្ងៃច័ន្ទ។ ទីផ្សារដែលទទួលបានប្រហែល 1% និងត្រូវបានឥឡូវអង្គុយខាងលើ $ កម្រិត 1450 ម្តងទៀត។ ជាមួយនឹងការបញ្ជាក់ថាករណីនេះយើងគិតថាកម្រិត $ 1550 នឹងនៅទីបំផុតត្រូវបានគោលដៅទោះបីជា $ 1500 ពិតណាស់នឹងមានផលប៉ះពាល់ផ្លូវចិត្តនៅលើអ្នកទិញនោះទេ។ យើងមិនរំពឹងថានឹងមានការផ្លាស់ទីកាន់តែខ្ពស់ទៅជាមានភាពងាយស្រួលនិងយ៉ាង pullback យាយដោយស្មោះត្រង់ជាមួយនឹងមិនភ្ញាក់ផ្អើលទេចំពោះយើង។ ប៉ុន្តែសម្រាប់អ្នកទាំងឡាយណាដែលមានបន្ថែមទៀតអ្នកវិនិយោគរយៈពេលវែងទីផ្សារនៅទីនេះគួរតែបន្តផ្តល់ជូននូវប្រាក់ចំណេញនៅក្នុងរយៈពេល
យូរអង្វែង។

អ្នកគួរតែទិញមាសឬបើមិនមាន?


អ្នកគួរតែទិញមាសឬបើមិនមាន? នោះហើយជាសំណួរនិងមនុស្សគ្រប់គ្នាហាក់ដូចជាមានចម្លើយមួយ។ ជាអកុសលពួកគេមិនដែលដូចគ្នានេះ។ ក្រុមអ្នកវិភាគមួយចំនួនភ័យខ្លាចក្នុងតម្លៃទាបនៃមាសដែលយើងបានឃើញនៅក្នុងខែកន្លងទៅនេះច្បាស់ណាស់ថានឹងមានសញ្ញាធ្លាក់ចុះមួយផ្សេងទៀត។ អ្នកផ្សេងទៀតនិយាយថាវាគ្រាន់តែជា fluke និងបង្ហាញអំពីភាពត្រឹមត្រូវដោយវាជាការពិតដែលថាតម្លៃមាសត្រូវបានធ្វើអោយប្រសើរឡើងនូវការ។ យឺតបាទប៉ុន្តែនៅតែធ្វើអោយប្រសើរឡើងនូវ។
តម្លៃមាសឡើងថ្លៃកំពុងឡើង $ 22,00 ទៅ $ 1,475.60 មួយអោន។ វាគឺជាការពិចារណាផងដែរខាងក្រោម $ 1,400 អោនពេលពីរសប្តាហ៍កន្លងទៅនេះអ្នកវិនិយោគជាច្រើនត្រូវបានដកដង្ហើមសញ្ញានៃការធូរស្រាលដូចដែលវាបានកើនឡើងឥតឈប់ឈរ។ ប្រសិនបើនិន្នាការនេះនៅតែបន្តមាសនឹងមានជាង $ 1,500 អោនមួយនៅក្នុងពេលវេលាទេ។
តើអ្វីទៅជាវិនិយោគិនចាំបាច់ត្រូវយល់ពីនោះគឺថាដូចជាជាមួយនឹងអ្វីមាសនឹងមានថ្ងៃល្អនិងថ្ងៃអាក្រក់របស់ពួកគេ។ បញ្ឈប់ការខាតបង់-នឹងកើតឡើងនិងប្រាក់ចំណេញនឹងត្រូវបានធ្វើ។ ប៉ុន្តែវិធីនោះទេគឺវាជា "រឿងរ៉ាវប្រាកដថា" ថាប្រសិនបើអ្នកនៅក្នុងការវិនិយោគលើមាសអ្នកនឹងចេញមកផ្តួលជាងអ្វីដែលអ្នកធ្លាប់គិតថាការស្រមើលស្រមៃ។ ប្រសិនបើអ្នកចូលមកក្នុងអាជីវកម្មមាសរំពឹងថានឹងវាឱ្យទៅជាមានភាពងាយស្រួលជាងអ្នកបានត្រូវបានគេច្រឡំឈឺចាប់ខ្លាំងណាស់។ ប្រសិនបើតម្លៃមាសឡើងថ្លៃជាចំណុចបង្កើនការអ្វី? មនុស្សគ្រប់រូបនឹងត្រូវបានម្ចាស់លុយនៅក្នុងមាស។ ជាសំណាងល្អឬជាអកុសលជាវិនិយោគិនមួយអ្នកត្រូវតែយកល្អជាមួយអាក្រក់។ វិនិយោគិននាពេលបច្ចុប្បន្ននេះកំពុងរៀនថាវិធីរឹង។ ប៉ុន្តែលោកសង្ឃឹមថាពួកគេនឹងភ្លេចទុក្ខព្រួយនាពេលបច្ចុប្បន្នរបស់ពួកគេនៅពេលដែលមាសនៅទីបំផុតទទួលបានត្រឡប់មកវិញបានរហូតដល់ការធ្វើពាណិជ្ជកម្មនៅ $ 1,800 អោនមួយនៅក្នុងពេលអនាគត។

Apr 26, 2013

26/04/2013


The XAU/USD pair had a bullish day as gold buying frenzy continued to drive prices higher. Also the recent weakness in the American dollar has been providing support for the shiny metal. Yesterday, the pair traded as high as 1469.18 after the bulls shattered the first barrier. In my previous analysis I had told that the bulls will eventually reach 1555 but frankly I was thinking that this area might be a cap on gold prices. Since we broke above the Ichimoku cloud (and we also have a bullish Tenkan Sen – Kijun Sen cross) on the 4-hour time frame, I believe the bulls will be controlling the XAU/USD pair in the-near term. Currently the pair is trading at 1476.53, just above the previous resistance level of 1473. If the bulls successfully hold above this level, we will probably see 1486 printing on our screen before a pull back occurs. Beyond 1486, the real challenge will be waiting the bulls at the 1495 - 1500 area.
លើសពី 1486 ដែលជាបញ្ហាប្រឈមពិតប្រាកដនឹងនៅរង់ចាំ ឡើង នៅ 1495 - 1500 តំបន់។


This is a vital level that the bulls have to pass in order to push prices higher. However, if the bears increase the pressure at 1486 and prices reverse, look for support at 1473, 1455 and 1444. Today investors' focus will be on the U.S. growth data, so expect some volatility.
XAUUSD Weekly